
For this Thursday Market Focus, I am looking at the NASDAQ 100 / US100 and the current market structure around the key support zones and the recent triangle breakout.
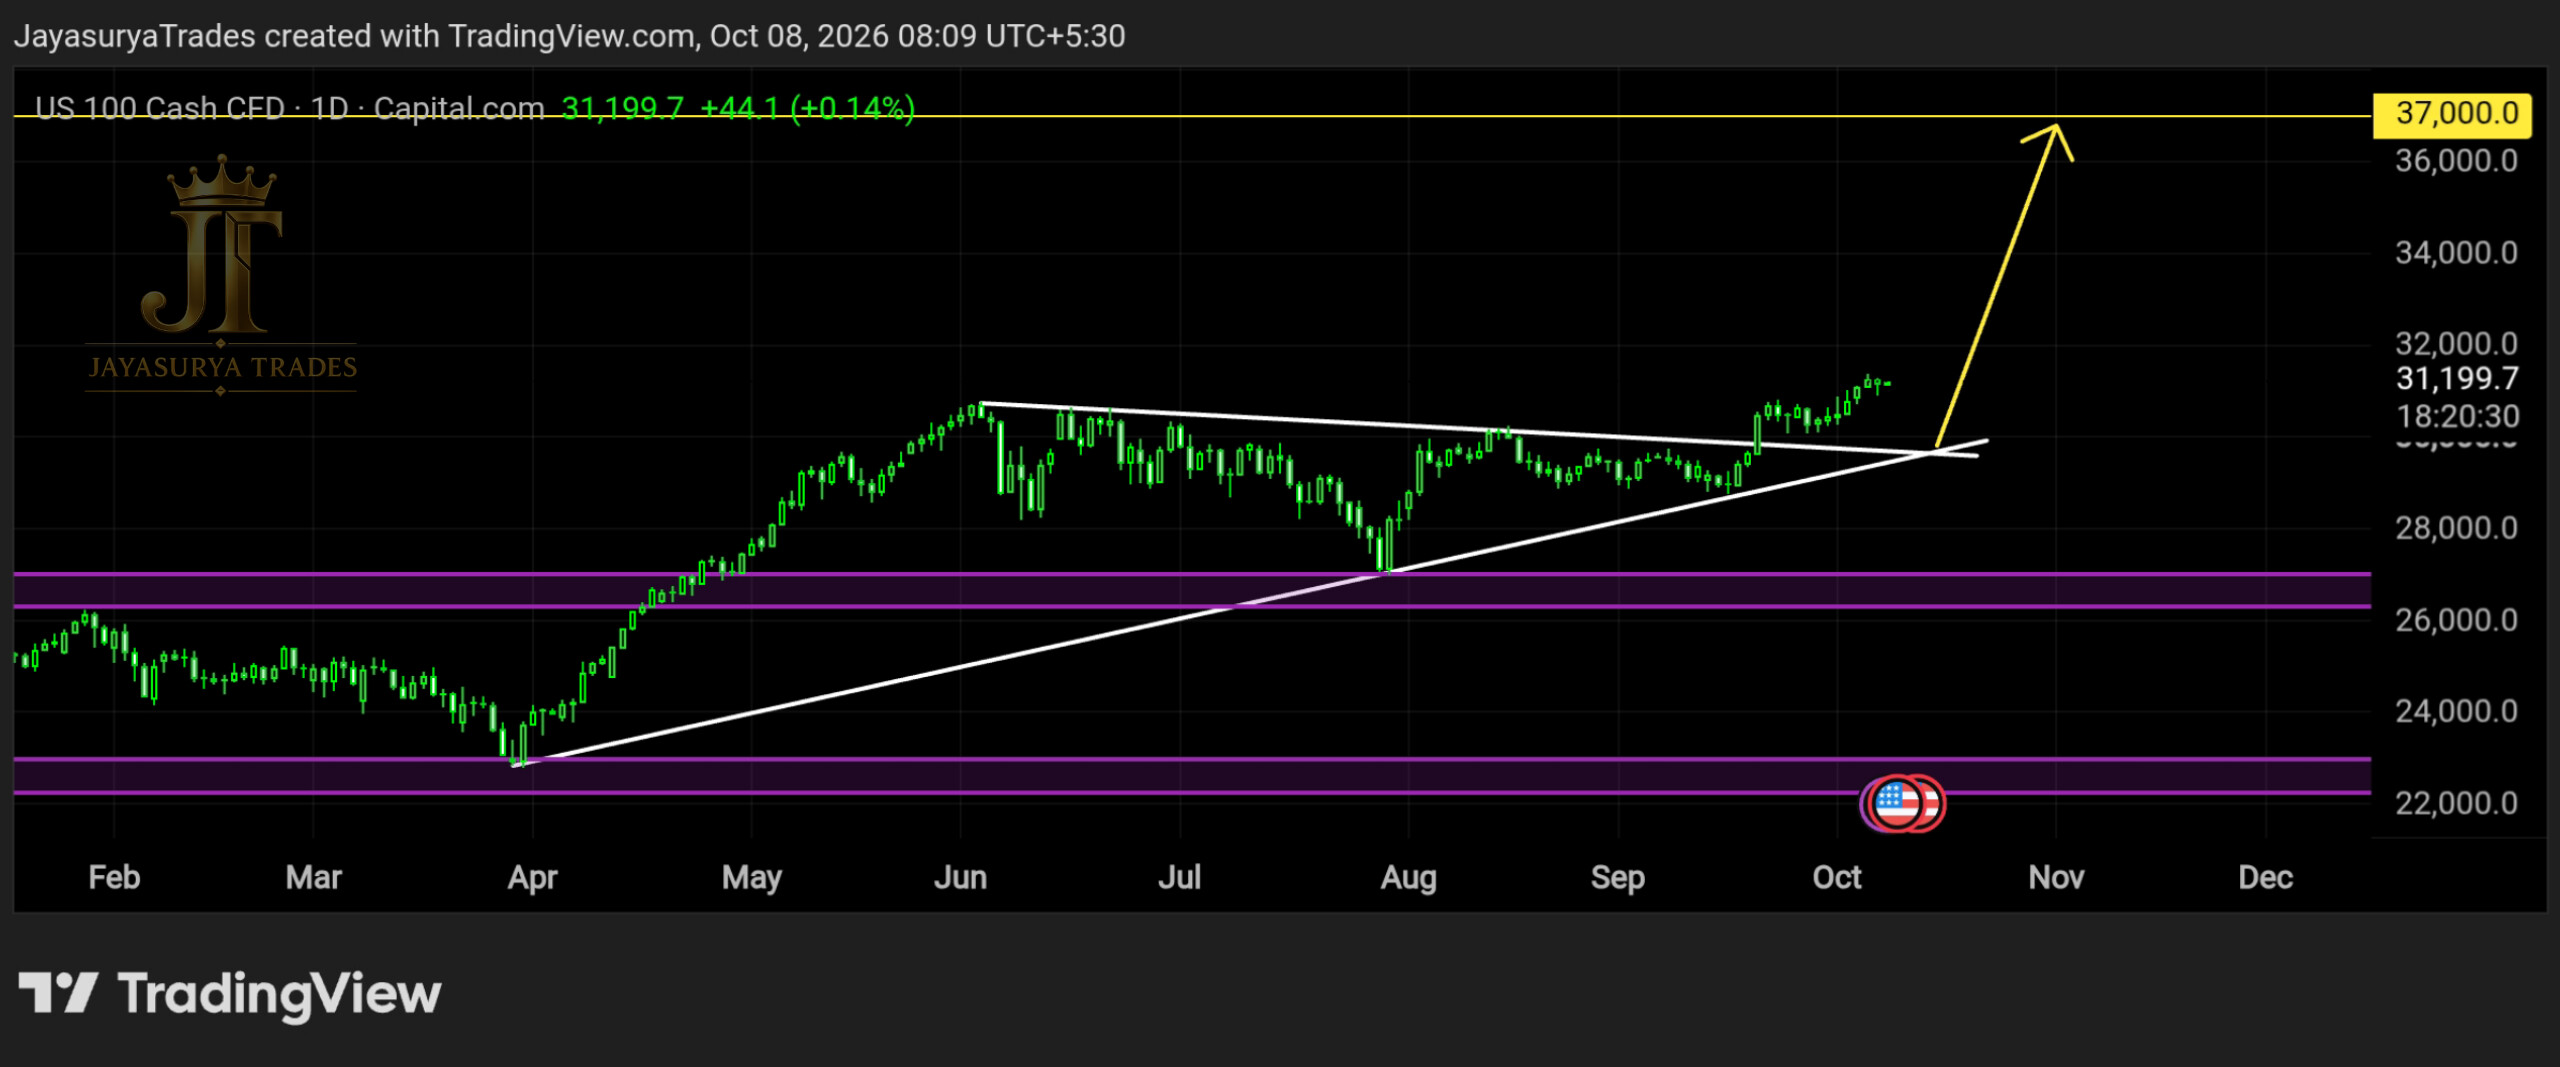
The market has recently formed a triangle pattern. The market has now broken upward from this pattern, and from the current structure, the breakout could potentially open the way for a larger upward move toward the 37,000 area.
The important part of this analysis is not simply the breakout itself, but whether the market can maintain the structure after the breakout. The support zones below remain important areas to watch if price moves back toward them.
Support 1 → 26,000–27,000
Support 2 → 22,000–23,000
Potential upside → 37,000
Current Market Structure
The key development on the chart is the triangle pattern and its upward breakout. The market has moved out of this structure to the upside, which creates the bullish scenario I am watching for today.
From a market-structure perspective, the breakout needs to be respected as a conditional development rather than treated as a guaranteed continuation. The market could potentially continue higher if the breakout structure holds.
26,000–27,000 — Immediate Support Zone
The first important support area in this analysis is the 26,000–27,000 range. This is the immediate support zone I am watching below the current breakout structure.
If the market moves back toward this area, its reaction around the support zone becomes important. A sustained structure above this zone would keep the upward scenario relevant, while a break through support would require the market structure to be reassessed.
22,000–23,000 — Major Support Zone
Beyond the immediate 26,000–27,000 support zone, the next major area I am watching is the 22,000–23,000 range.
This is the second major support area in the analysis. If the market were to move significantly lower and break through the first support zone, this 22,000–23,000 area becomes the next important level to monitor.
For the current bullish scenario, these support levels provide the structural areas to watch rather than levels to ignore if the market pulls back.
Potential Move Toward 37,000
The main scenario I am watching today is an upward continuation following the recent triangle breakout. If the breakout structure holds, the NASDAQ 100 could potentially continue upward and reach the 37,000 area.
This is the upside scenario from the current structure. It should remain conditional on the breakout holding and the market continuing to respect the structure that has developed.
Key support: 26,000–27,000
Major support: 22,000–23,000
Potential upside scenario: 37,000
What I Am Watching Now
Triangle Breakout
The first thing I am watching is whether the recent upward breakout from the triangle pattern can hold. The breakout is the key structural development behind today's bullish scenario.
Support 1 — 26,000–27,000
If price pulls back, the immediate support area is the 26,000–27,000 range. The market's reaction around this area will be important for understanding whether the current structure remains intact.
Support 2 — 22,000–23,000
If the first support zone fails, the next major support area is the 22,000–23,000 range. This is the deeper structural level I am watching.
37,000 Upside Scenario
If the upward breakout continues to hold and the market maintains its structure, the potential upside area I am watching is 37,000.
The Two Scenarios I Am Watching
Bullish Continuation Scenario
If the triangle breakout holds and the market continues to maintain its upward structure, the NASDAQ 100 could potentially continue higher toward 37,000.
Support-Based Reassessment Scenario
If the market moves lower after the breakout, the first area to watch is 26,000–27,000. A deeper move would bring the 22,000–23,000 major support zone into focus.
The important point is to let the market show whether the breakout is holding rather than assuming that every move after the breakout must continue upward.
Key Takeaways
- The NASDAQ 100 has recently formed a triangle pattern.
- The market has broken upward from the triangle.
- 26,000–27,000 is the immediate support zone being watched.
- 22,000–23,000 is the major support zone beyond the first level.
- If the breakout structure holds, the market could potentially move toward 37,000.
- The 37,000 level remains a potential upside scenario, not a guaranteed outcome.
- If price pulls back, the reaction around the support zones becomes important for assessing the structure.
- The focus remains on the chart structure, levels and confirmation rather than forcing a prediction.
The objective is not to predict every movement. It is to watch the triangle breakout, monitor the 26,000–27,000 and 22,000–23,000 support zones, and see whether the structure can support the potential move toward 37,000.
Watch the triangle breakout.
Respect the support zones.
Let the market confirm the move.
One day. One market. One focused analysis.
Levels. Structure. Scenarios. Confirmation.
No hype. Just how the market behaves.
Watch. Wait. Confirm.
Risk Disclaimer
This analysis is provided for educational and informational purposes only and
should not be considered financial advice or a recommendation to buy or sell
any financial instrument.
Trading involves substantial risk. Always conduct your own research and follow
your own trading plan and risk-management rules.