
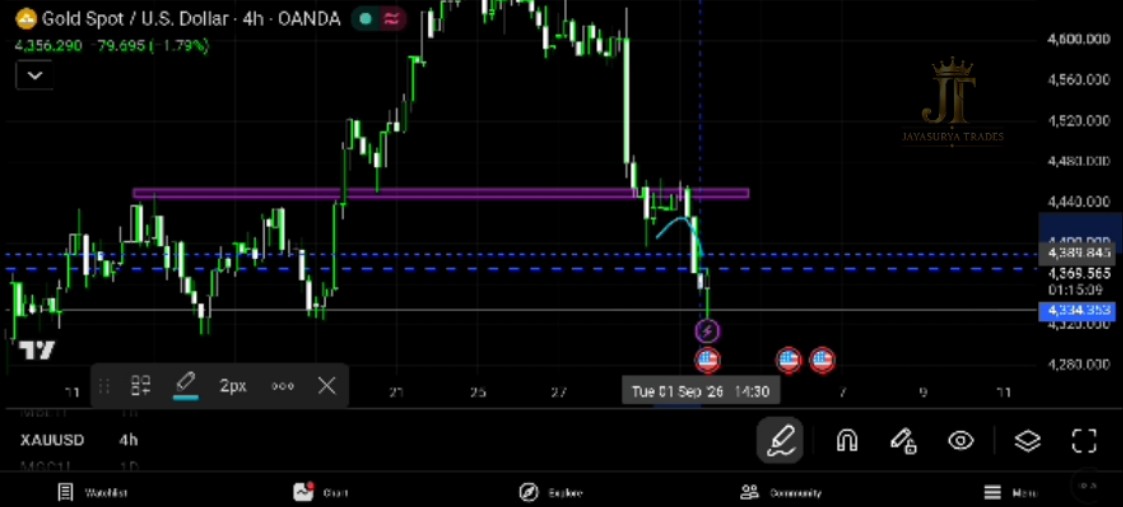
In yesterday's analysis, made on August 31, 2026 for September 1, I identified the 4375.178–4334.353 area as an important key decision zone. Price has now fallen from its previous market area and reached the 4375.178–4334.353 zone, exactly as identified in the previous analysis. Now, a new market structure has formed and the focus shifts to how Gold behaves around these important levels.
Watch Today's XAUUSD Analysis
What Happened After Yesterday's Analysis?
In the previous analysis made on August 31 for September 1, I identified the 4375.178–4334.353 area as the key decision zone. Price has now fallen from its previous market area and reached this zone exactly as identified in that analysis.
This is an important development because the market has now reached the area identified previously, and a new structural signal has appeared on the 4-hour timeframe.
The reaction around these levels will be important for the next direction of Gold.
4-Hour Head & Shoulders Breakout
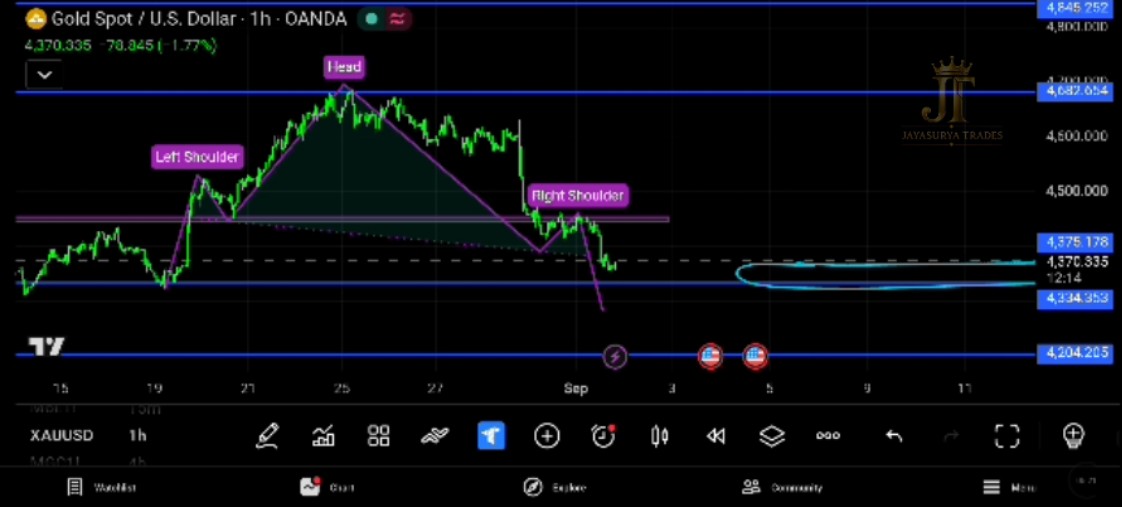
Today, I have spotted a specific Head and Shoulders pattern on the 4-hour timeframe. The pattern has broken downward, and according to the principles I follow to identify breakout areas, this is an important structural development in the current market.
A Head and Shoulders pattern breaking to the downside can signal the start of a downtrend. Since the pattern has formed and the breakout has occurred, the current market can be considered to be at the start of a potential downtrend from a pattern perspective.
Aggressive vs Conservative Approach
For an aggressive approach, traders may generally begin considering the Head and Shoulders breakout as the start of a downtrend because the pattern has already broken downward.
For a conservative approach, the Head and Shoulders breakout can be treated as one confirmation, while waiting for a candle close downward beyond the 4375.178–4334.353 price zone for additional confirmation of the bearish move.
The confirmation of price behaviour around the key zone remains important before considering the next move.
The Key Decision Zone
The key decision zone identified in the previous analysis remains:
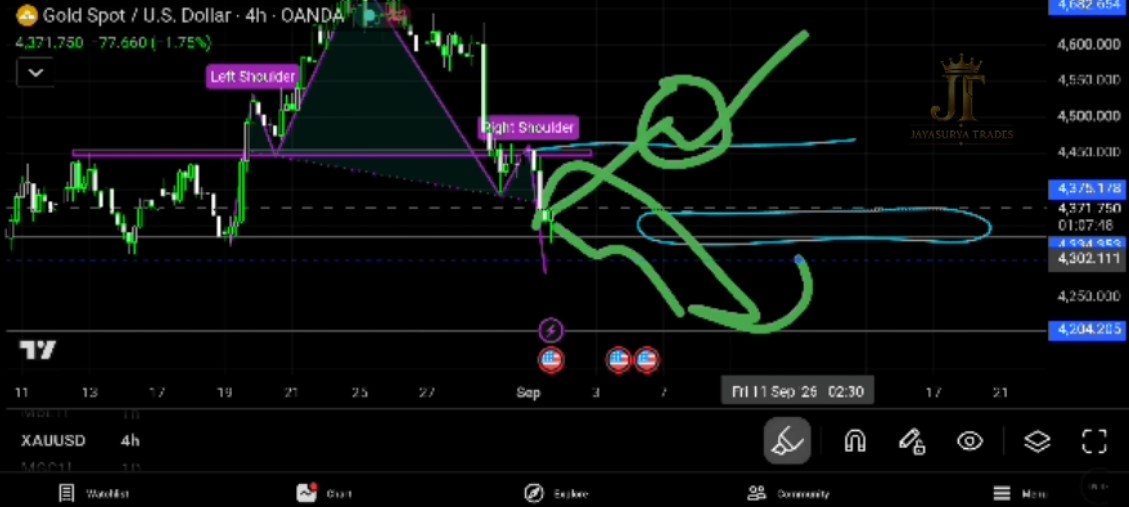
The area between 4375.178 and 4334.353 remains an important decision zone. If this zone breaks downward and the market confirms the move with a candle close beyond the zone, the bearish structure could continue to develop.
This remains the key decision zone I am watching for Gold. The reaction and confirmation around the zone matter more than simply touching the level.
Bearish Scenario
With the 4-hour Head and Shoulders pattern already broken downward, the bearish scenario is the structure I am currently watching. For a more conservative confirmation, I want to see the market make a candle close below the 4375.178–4334.353 zone.
If the downtrend has started and price continues to move in our favour according to the analysis, the next immediate support I am watching is:
If the bearish move continues after the key decision zone is broken, 4204.205 becomes the next important support level to monitor.
When Can I Look For Bullish Setups?
Since the Head and Shoulders pattern has broken downward, bullish setups are not the immediate focus. I would look for bullish setups only after the market makes a candle close above 4450.140.
If the market makes a confirmed candle close above 4450.140, bullish setups can come back into focus. The immediate resistance I am watching above that level is:
A candle close above 4450.140 would provide the confirmation I am looking for before considering bullish setups. If that confirmation occurs, 4682.654 becomes the next important resistance level to monitor.
How I Am Approaching Gold Tomorrow
For September 2, the focus is not about predicting every movement. The Head and Shoulders breakout has provided an important structural signal. Now I am watching how price behaves around the key levels and waiting for confirmation.
- Yesterday's analysis identified the 4375.178–4334.353 decision zone, and price has now reached that area.
- A 4-hour Head and Shoulders pattern has formed and broken downward.
- Aggressive traders may consider the breakout as the start of a potential downtrend.
- Conservative traders may wait for a candle close below 4375.178–4334.353 for additional confirmation.
- If the bearish move continues, watch 4204.205 as the next immediate support.
- For bullish setups, wait for a candle close above 4450.140.
- If price confirms above 4450.140, watch 4682.654 as the next resistance.
There is no need to force a prediction before the market confirms the move. The objective is to identify the structure, identify the important levels, and allow price behaviour to confirm which scenario is developing.
Know the structure.
Know the level.
Wait for confirmation.
Let the market confirm the move.
Key Takeaways
- Yesterday's analysis identified the 4375.178–4334.353 decision zone, and price has now reached that zone.
- A Head and Shoulders pattern has formed on the 4-hour timeframe and broken downward.
- The breakout can be considered a potential start of a downtrend from a pattern perspective.
- Aggressive traders may consider the breakout, while conservative traders may wait for a candle close below the key decision zone.
- 4375.178–4334.353 remains the important bearish confirmation zone.
- If the bearish move continues, 4204.205 is the next immediate support to monitor.
- A candle close above 4450.140 can bring bullish setups back into focus.
- Above 4450.140, the next resistance I am watching is 4682.654.
- The reaction around the key levels matters more than simply touching the level.
Know the structure.
Know the level.
Wait for confirmation.
Let the market confirm the move.
Risk Disclaimer
This analysis is provided for educational and informational purposes only and should not be considered financial advice or a recommendation to buy or sell any financial instrument. Trading involves substantial risk. Always conduct your own research and follow your own trading plan and risk-management rules.