
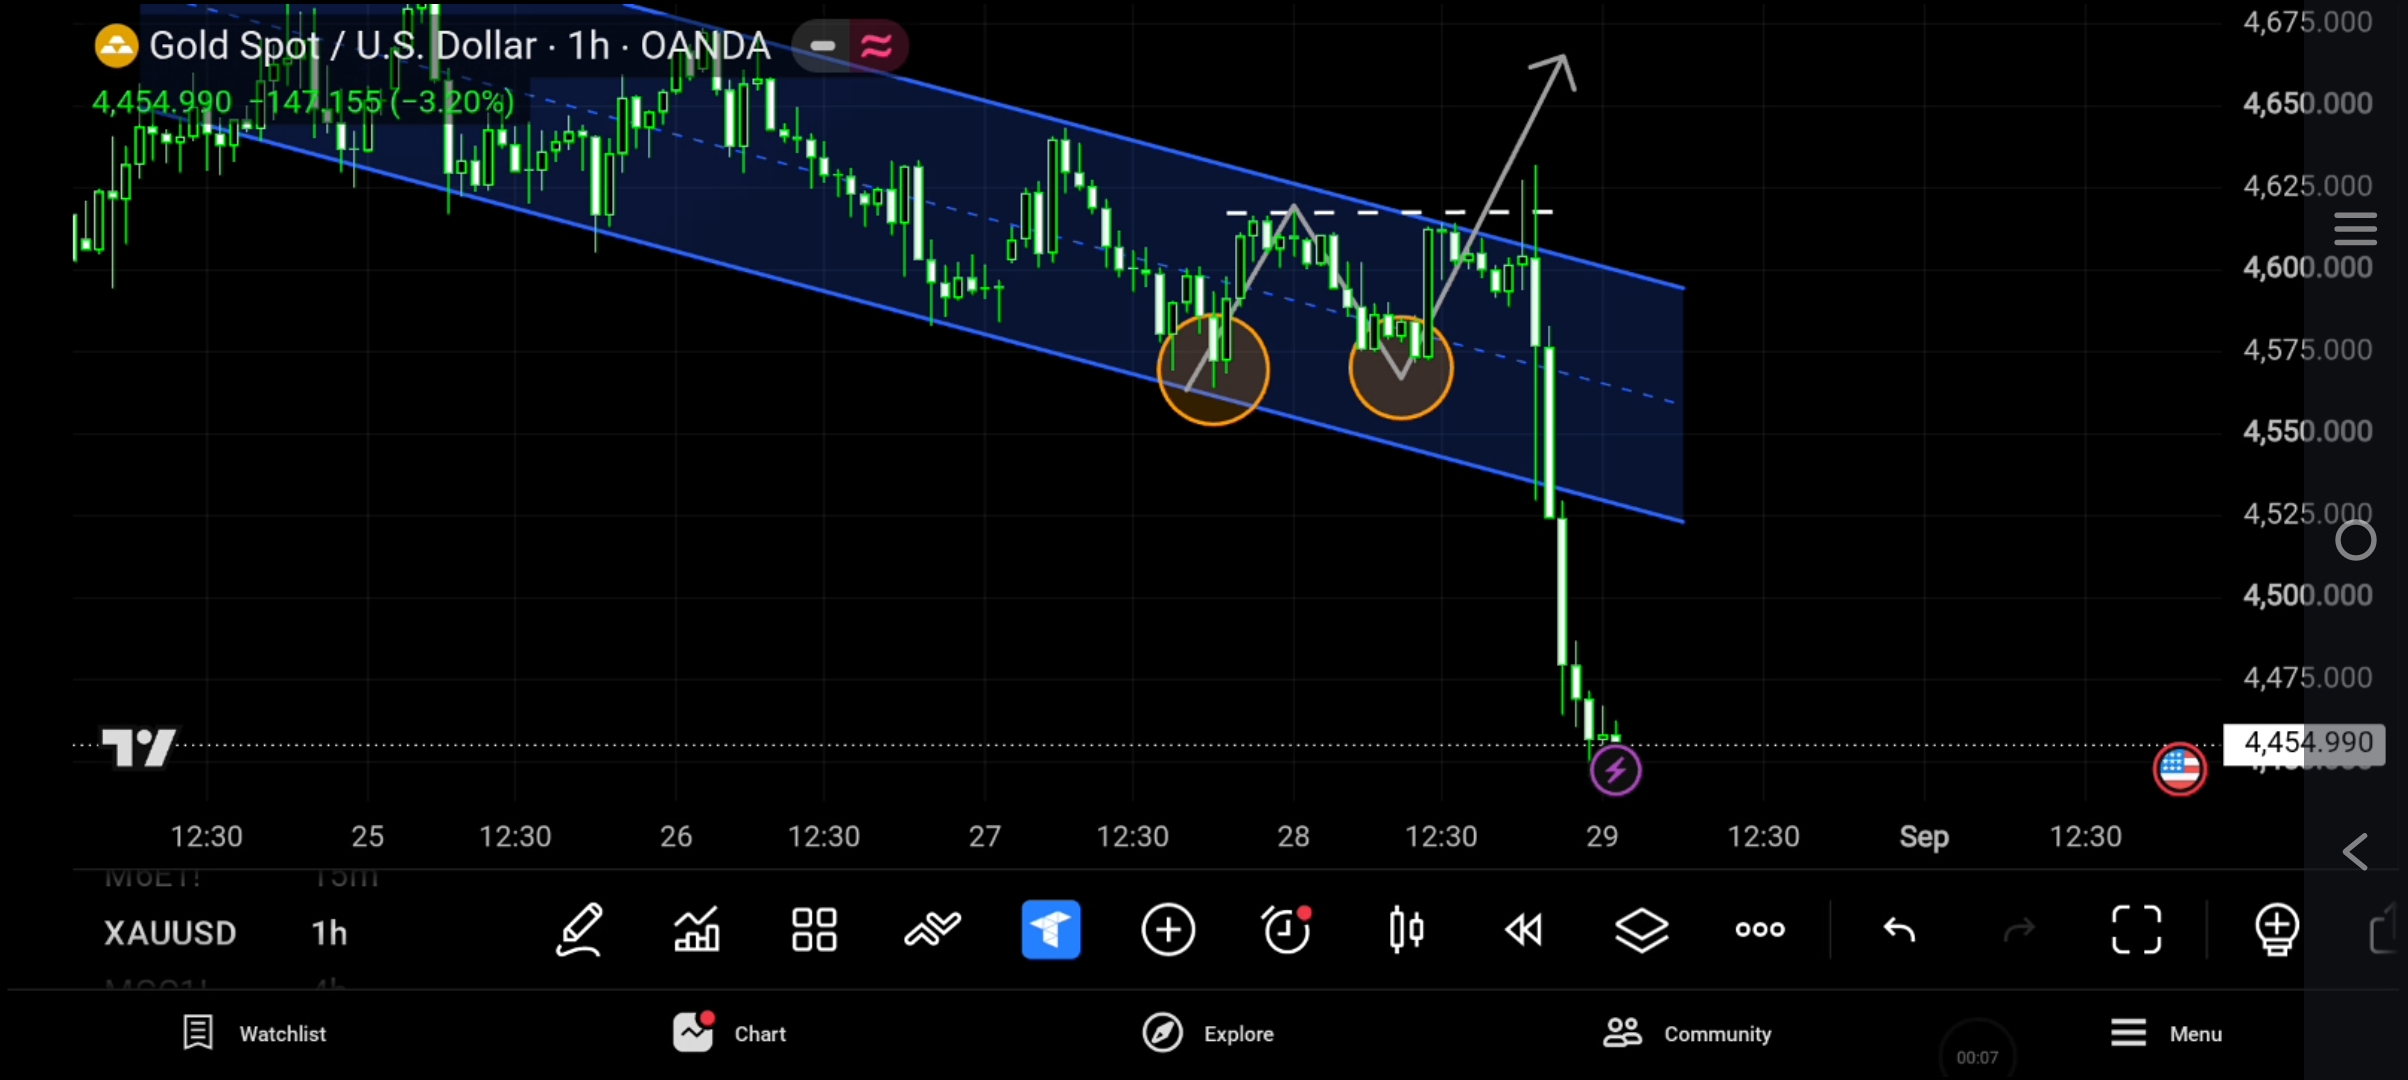
In our previous analysis, we identified that a Double Bottom pattern was potentially forming in the Gold market. However, we clearly stated that certain conditions needed to be fulfilled before the pattern could be considered confirmed. According to our trading principles, the Double Bottom was not confirmed.
Watch the XAUUSD Analysis
Double Bottom — Why It Wasn't Confirmed
One of the important confirmation conditions was that, after forming the Double Bottom, price needed to break above the dashed resistance line marked on Chart 1. That breakout did not occur. Therefore, based on our predefined principles, we did not consider the Double Bottom to be a confirmed bullish pattern.
We wait for the predefined confirmation conditions before considering the setup valid.
The Parallel Channel Breakdown
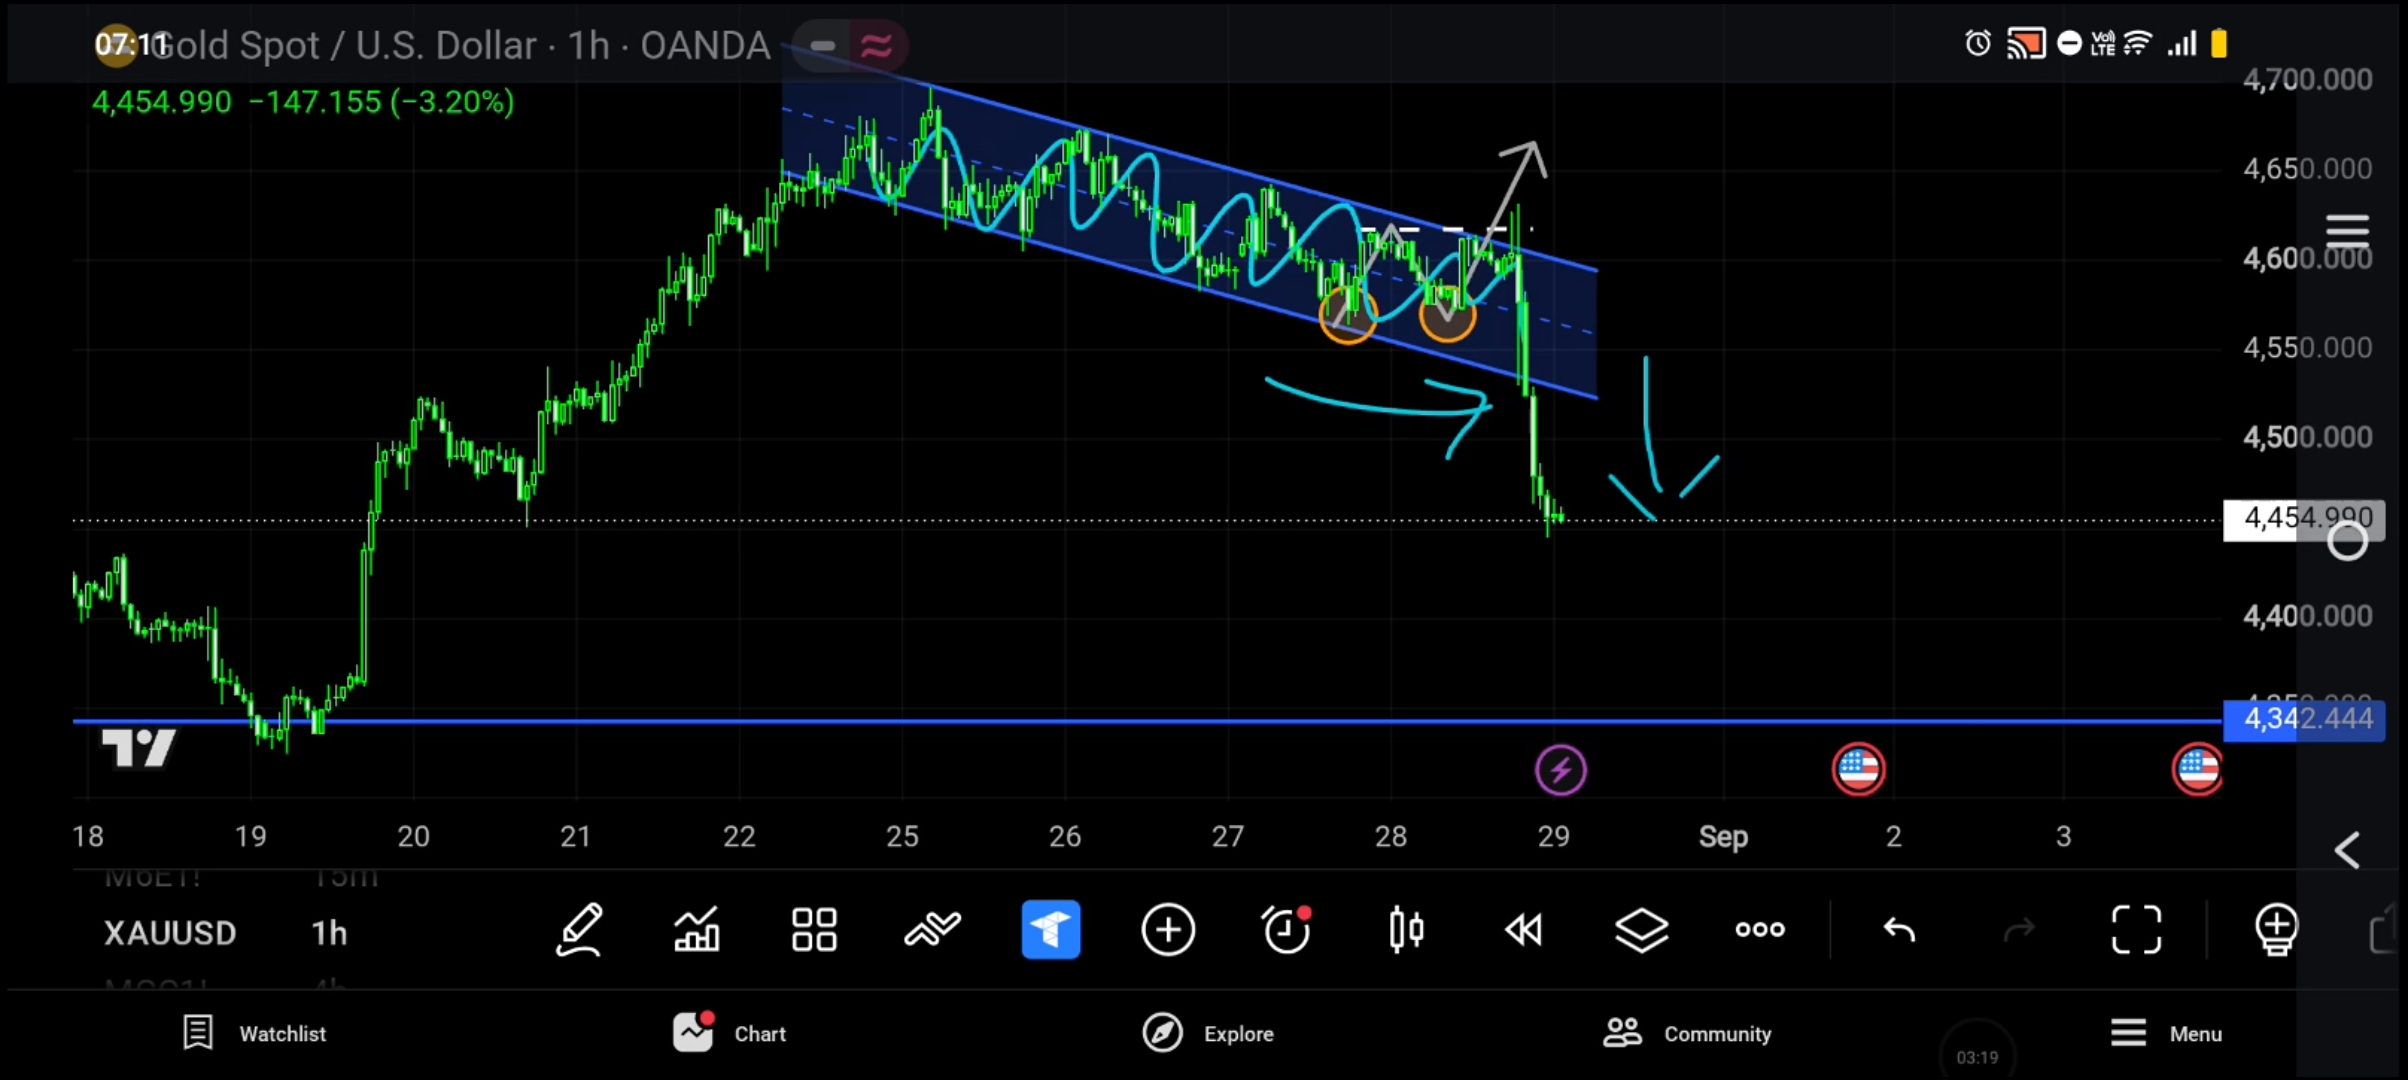
In our previous analysis, we also discussed a parallel channel in which price had been moving. The principle was that a decisive breakout from the channel could potentially lead to a significant move in the direction of the breakout. Whether the breakout occurred to the upside or downside, the direction of the break was important.
As shown in the current chart, price eventually broke downward from the parallel channel, followed by a strong bearish move. This was consistent with the scenario discussed in our previous analysis.
The channel breakdown could therefore provide a potential opportunity for a sell-side setup, subject to confirmation and proper risk management.
Price Behaviour Inside the Channel
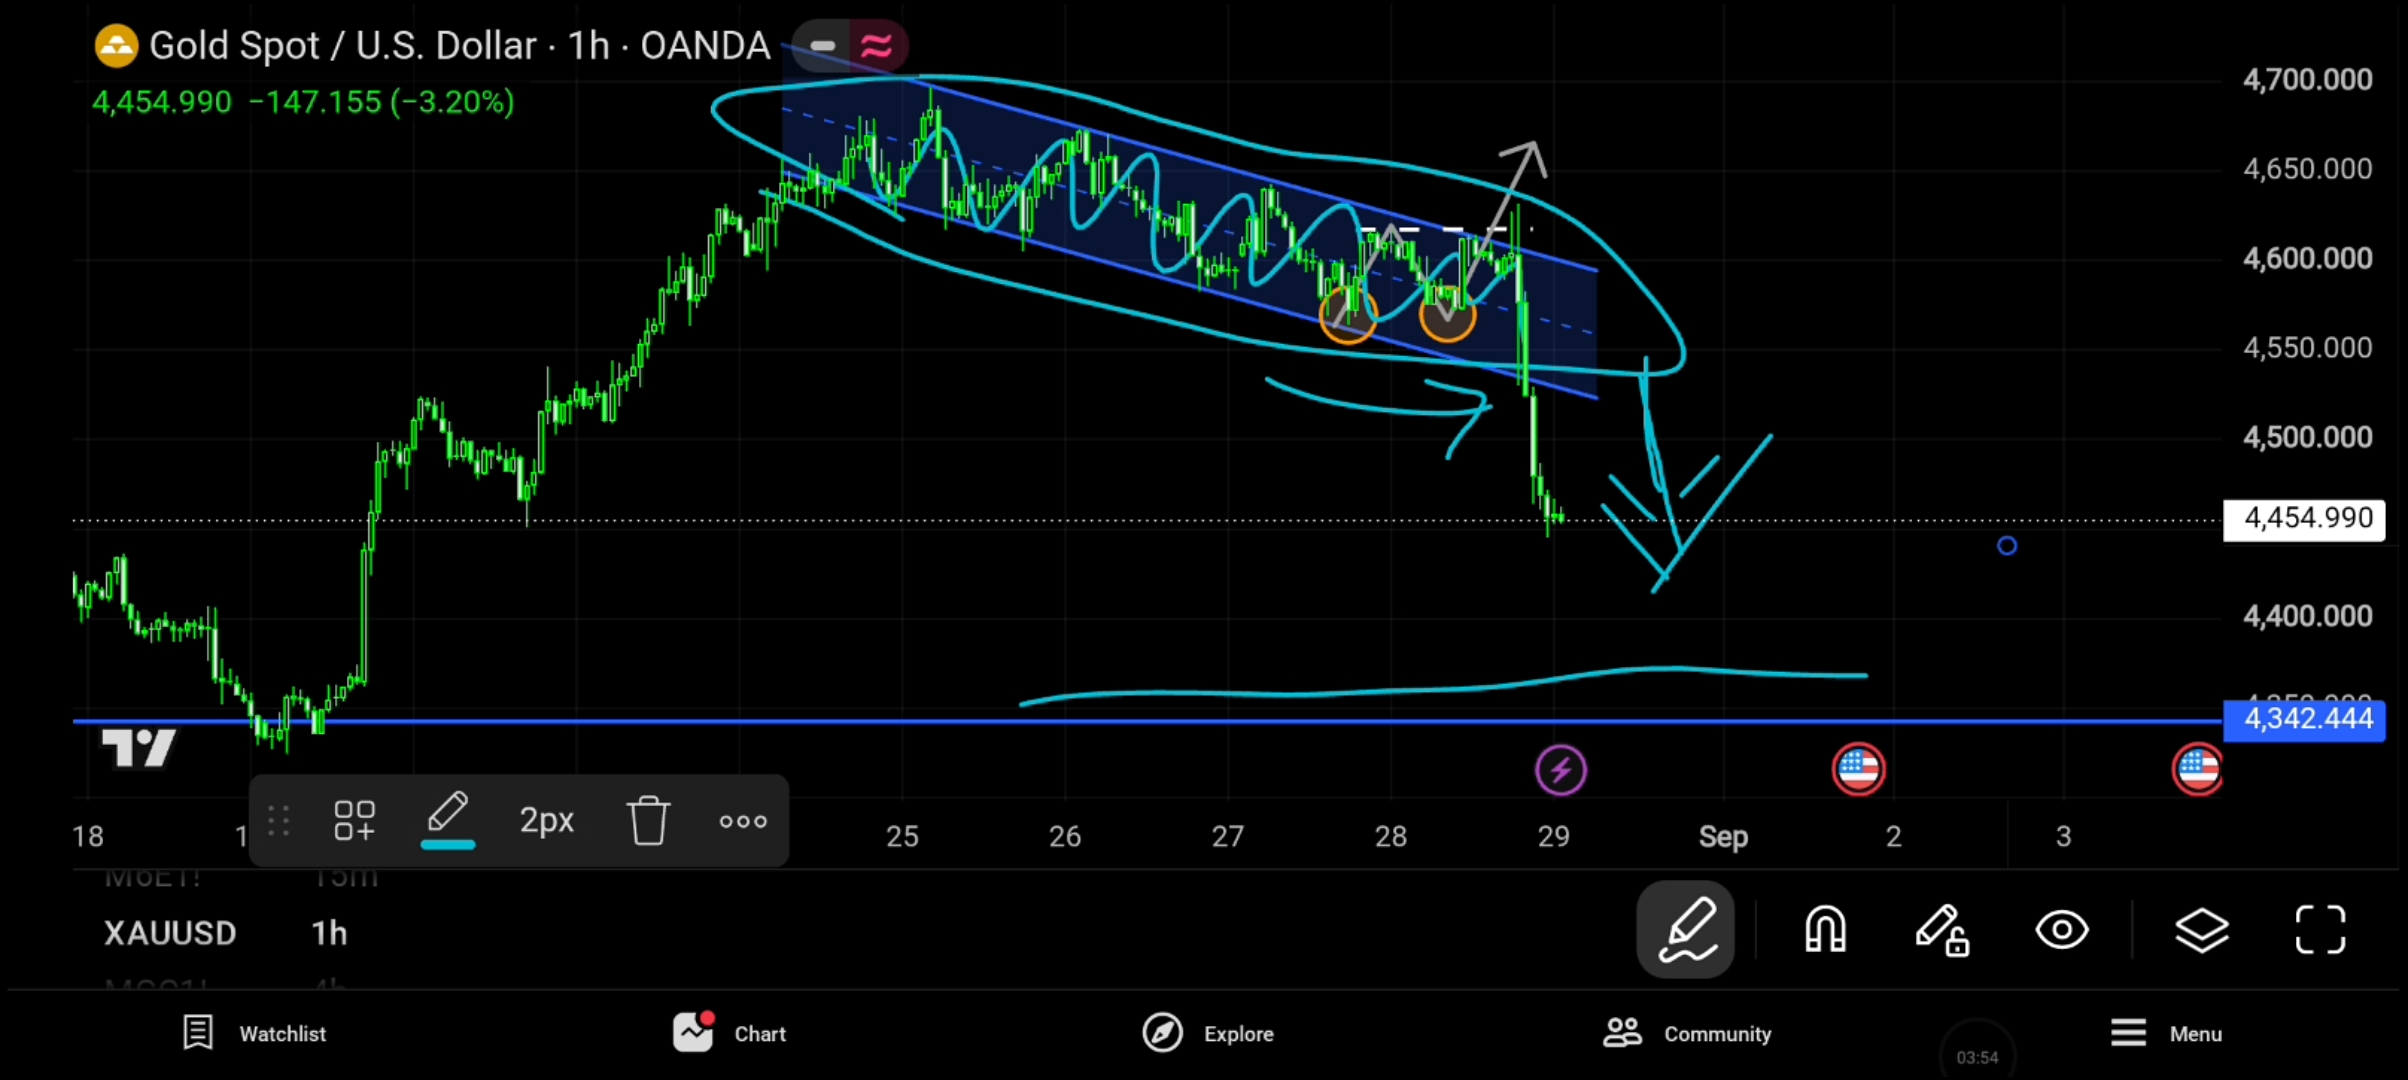
In Chart 3, we highlighted how long price had been moving within the parallel channel. Understanding this price behaviour was important because the eventual breakout gave us additional information about the direction of the move.
After the breakdown, we also identified potential support areas where selling pressure could potentially slow down or where price could react.
Important Support Levels
Immediate Support — 4454.990
4454.990 is the next immediate support level identified in our analysis. Price behaviour around this level needs to be observed carefully because it could act as a temporary barrier to further downside movement.
Major Support — 4342.444
4342.444 is a major support level marked on the chart. A strong break below this level, particularly with confirmation on higher timeframes, could potentially strengthen the case for a broader bearish or downtrend scenario.
Is the Downtrend Confirmed?
This is where it is important to distinguish between bearish movement and a confirmed downtrend. Although price has broken downward from the channel and produced a strong bearish move, our predefined confirmation principles still matter.
We do not change our interpretation simply because price has moved strongly. We wait for the conditions we established beforehand.
Key Takeaways
- The Double Bottom was identified as a potential pattern, but it was not confirmed.
- Price failed to break above the required confirmation level marked on Chart 1.
- Price subsequently broke downward from the parallel channel.
- The channel breakdown was followed by a strong bearish move.
- 4454.990 is an important immediate support level.
- 4342.444 is a major support level to monitor.
- A strong break below 4342.444 on higher timeframes could potentially support broader bearish or downtrend confirmation.
- Until the required conditions are met, we avoid prematurely calling a confirmed downtrend.
We don't trade the pattern simply because we can see it.
We wait for the conditions that confirm it.
Risk Disclaimer
This analysis is provided for educational and informational purposes only and should not be considered financial advice or a recommendation to buy or sell any financial instrument. Trading involves substantial risk. Always conduct your own research and follow your own trading plan and risk-management rules.